The MACD (Moving Average Convergence Divergence) is a popular technical indicator used by many traders to analyze market trends and momentum. This indicator combines several elements to provide trading signals and is widely recognized for its versatility and effectiveness. This article will explain in detail what the MACD is, how it is calculated, how to interpret it, and how to use it in your trading strategies.
What is the MACD?
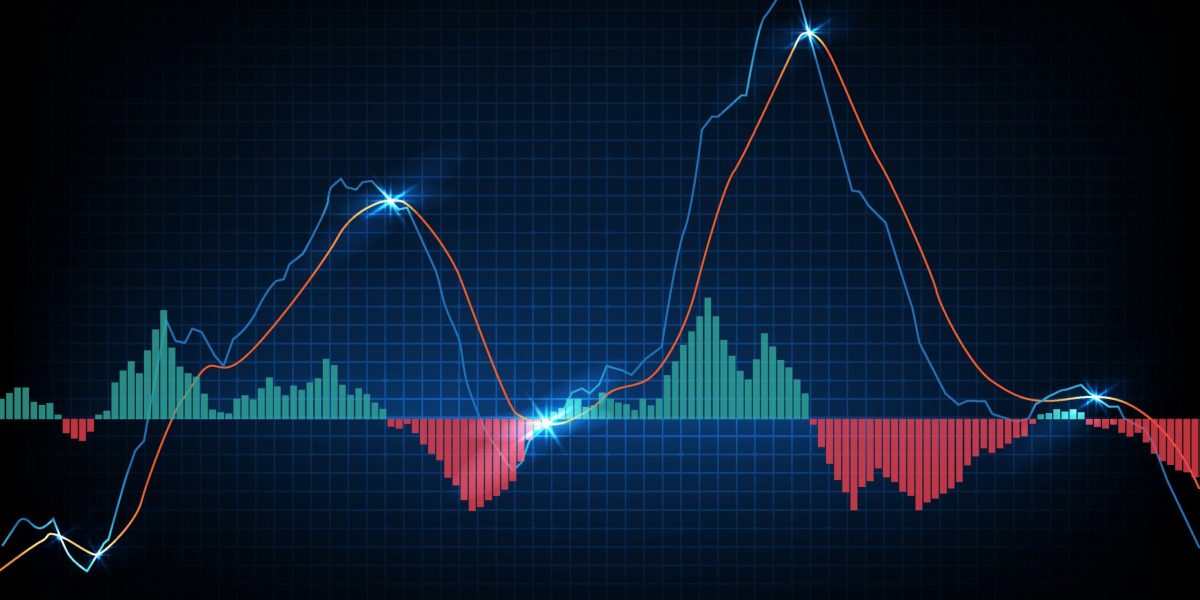
The MACD is a momentum indicator that shows the relationship between two exponential moving averages (EMAs) of an asset’s price. It consists of three main components:
- The MACD Line: Calculated by subtracting the 26-day EMA from the 12-day EMA.
- The Signal Line: The 9-day EMA of the MACD Line.
- The MACD Histogram: Represents the difference between the MACD Line and the Signal Line.

How is it Calculated?
- Calculate the 12-day EMA (EMA12): An exponential moving average over 12 days.
- Calculate the 26-day EMA (EMA26): An exponential moving average over 26 days.
- MACD Line: MACD = EMA12 – EMA26
- Signal Line: Signal = 9-day EMA of the MACD Line
- MACD Histogram: Histogram = MACD – Signal Line

Why is the MACD Important?
The MACD is important because it helps traders identify changes in trend direction, trend strength, and potential turning points. It is especially useful in volatile markets where trends can change quickly.

How to Interpret the MACD?
- MACD and Signal Line Crossovers: A bullish crossover (MACD crosses above the signal line) can indicate a buy signal. A bearish crossover (MACD crosses below the signal line) can indicate a sell signal.
- Position Relative to the Zero Line: When the MACD Line is above zero, it can indicate a bullish trend. When it is below zero, it can indicate a bearish trend.
- MACD Histogram: Bars above the zero line indicate increasing bullish pressure, while bars below indicate increasing bearish pressure.

Practical Examples
- Bullish and Bearish Crossovers

- Divergences

Contributions from Specialists
Many experts and technical analysts, such as Gerald Appel, the inventor of the MACD, and authors like John Murphy, have significantly contributed to the understanding and application of this indicator. Their work has helped popularize the MACD and make it an essential tool for traders worldwide.

Conclusion
The MACD is a powerful tool for technical traders, providing valuable insights into market trends and momentum. By understanding how it works and how to interpret it, you can enhance your analysis and decision-making in trading. Remember that, like all indicators, the MACD is most effective when used in combination with other tools and analyses.
